flowchart TB
  au[Aprendizaje\nAutomático\nClásico]
  sp[Supervisada]
  au--Datos numéricos o categóricos-->sp
  us[No supervisada]
  au--Datos no están clasificados-->us
  cl[Clasificación]
  sp--Predice categoría-->cl
  rs[Regresión]
  sp--Predice numero-->rs
  ag[Agrupación]
  us--Divide por similitudes-->ag
  rd[Reducción\n de dimensiones]
  us--Busca dependencias\nescondidas-->rd
  as[Asociación]
  us--Identifica secuencias-->as
1 - Introducción
Introducciendo Tidymodels
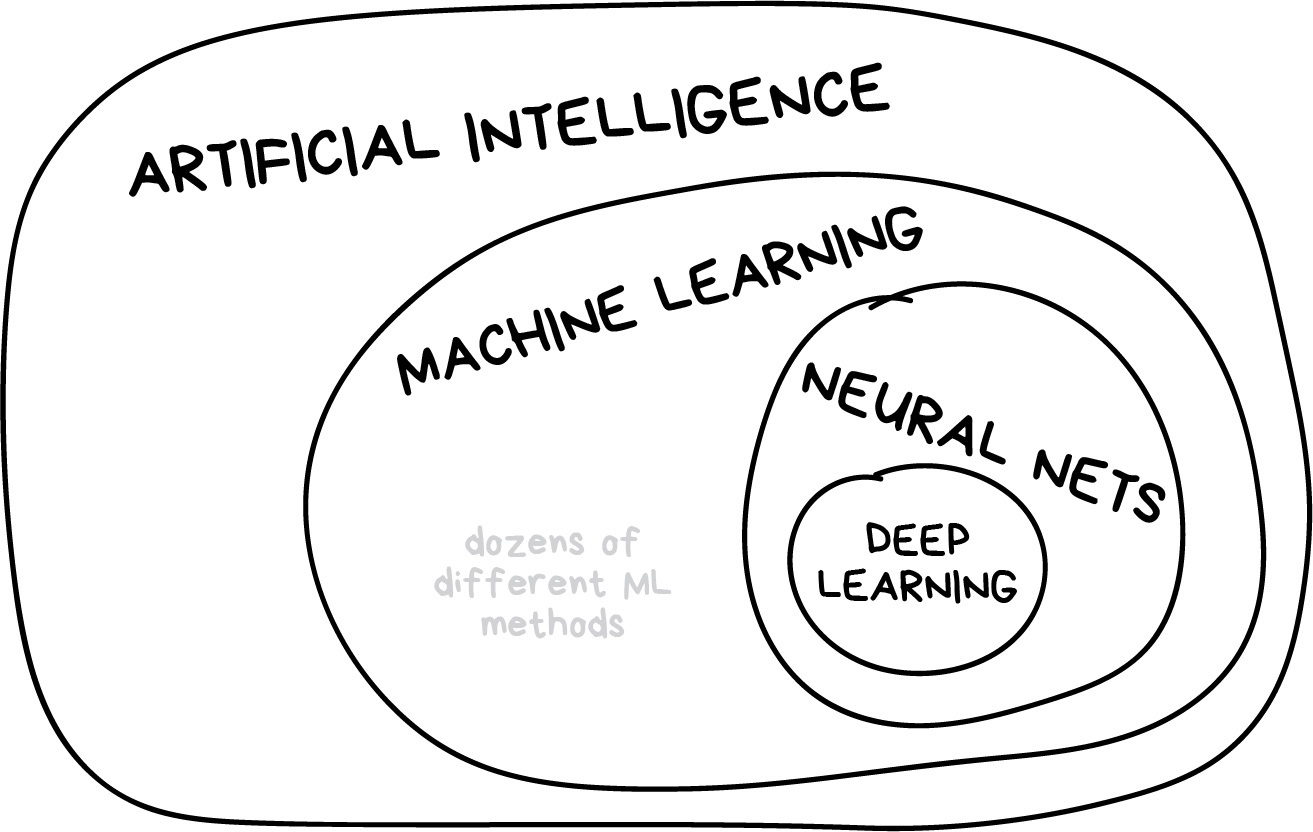
¿Que es aprendizaje automático?

¿Que es aprendizaje automático?
- ¿Este es tu sistema para aprendizaje automático?
- Sí, le tiramos los datos a este monton de algebra linear, y después tomamos las repuestas que salen
- ¿Y si las respuestas están equivocadas?
- Lo empezamos a mezclar hasta que algo se ve como correcto
¿Que es aprendizaje automático?
Tu turno

¿Como se relacionan las estadísticas y el aprendizaje automático?
¿Como se parecen? ¿Cuales son sus diferencias?
03:00
¿Que es Tidymodels? ![]()
library(tidymodels)
#> ── Attaching packages ──────────────────────────── tidymodels 1.1.1 ──
#> ✔ broom        1.0.5      ✔ rsample      1.2.0
#> ✔ dials        1.2.1      ✔ tibble       3.2.1
#> ✔ dplyr        1.1.4      ✔ tidyr        1.3.1
#> ✔ infer        1.0.6      ✔ tune         1.1.2
#> ✔ modeldata    1.3.0      ✔ workflows    1.1.4
#> ✔ parsnip      1.2.0      ✔ workflowsets 1.0.1
#> ✔ purrr        1.0.2      ✔ yardstick    1.3.0
#> ✔ recipes      1.0.10
#> ── Conflicts ─────────────────────────────── tidymodels_conflicts() ──
#> ✖ purrr::discard() masks scales::discard()
#> ✖ dplyr::filter()  masks stats::filter()
#> ✖ dplyr::lag()     masks stats::lag()
#> ✖ recipes::step()  masks stats::step()
#> • Learn how to get started at https://www.tidymodels.org/start/