03:00
1 - Introduction
Machine learning with tidymodels
👀

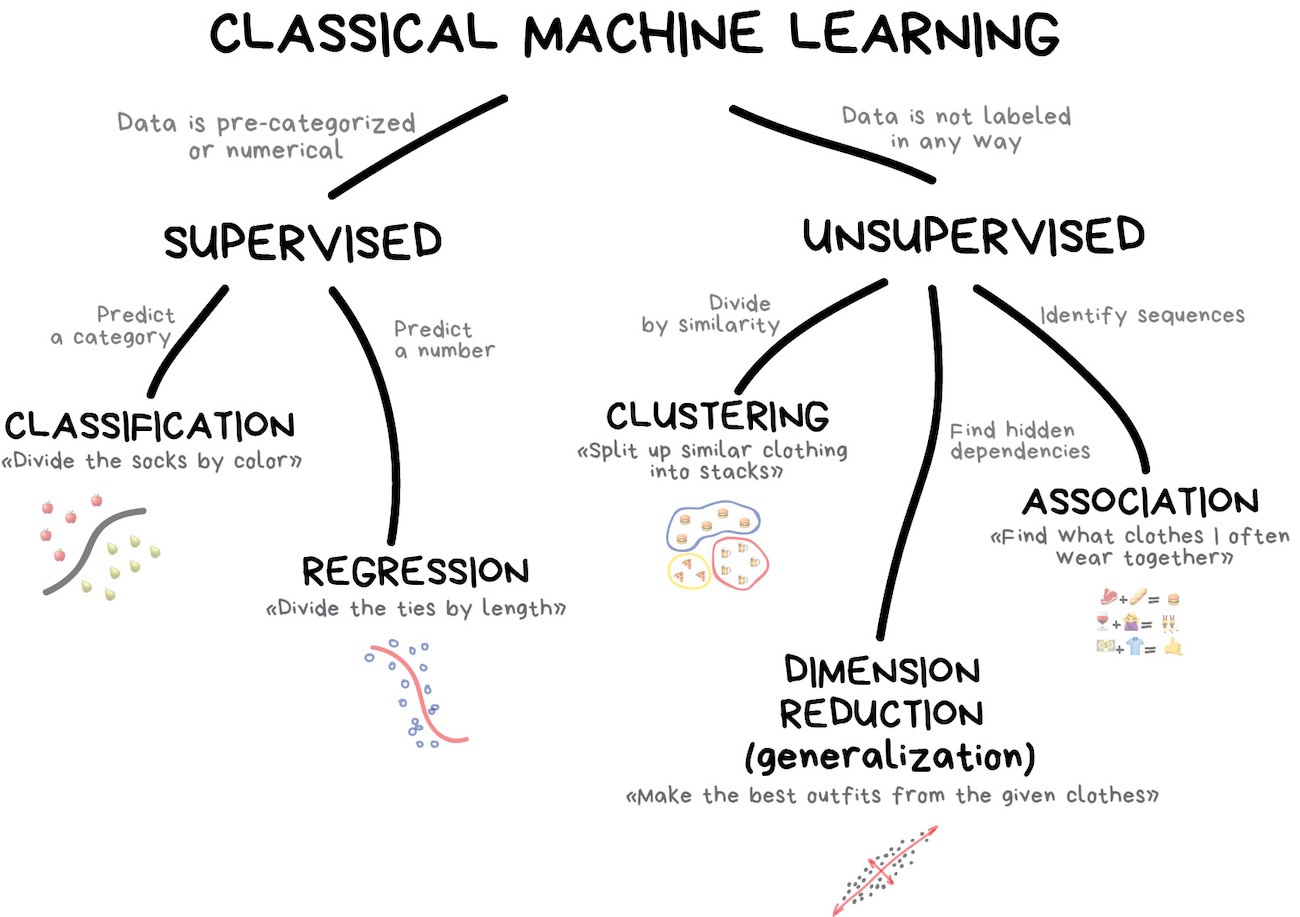
What is machine learning?

What is machine learning?
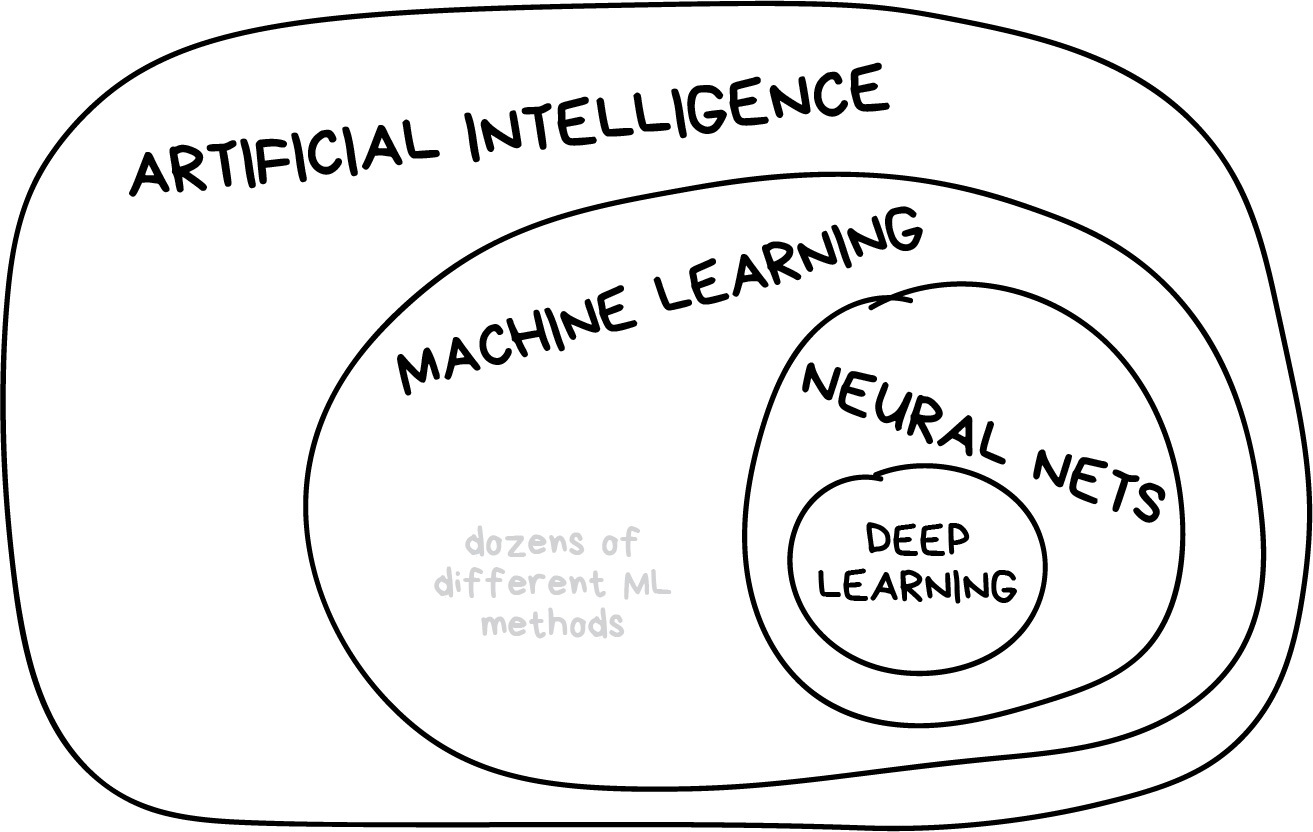
What is machine learning?
Your turn

How are statistics and machine learning related?
How are they similar? Different?
What is tidymodels? ![]()

library(tidymodels)
#> ── Attaching packages ──────────────────────────── tidymodels 1.1.0 ──
#> ✔ broom        1.0.5     ✔ rsample      1.1.1
#> ✔ dials        1.2.0     ✔ tibble       3.2.1
#> ✔ dplyr        1.1.2     ✔ tidyr        1.3.0
#> ✔ infer        1.0.4     ✔ tune         1.1.1
#> ✔ modeldata    1.1.0     ✔ workflows    1.1.3
#> ✔ parsnip      1.1.0     ✔ workflowsets 1.0.1
#> ✔ purrr        1.0.1     ✔ yardstick    1.2.0
#> ✔ recipes      1.0.6
#> ── Conflicts ─────────────────────────────── tidymodels_conflicts() ──
#> ✖ purrr::discard() masks scales::discard()
#> ✖ dplyr::filter()  masks stats::filter()
#> ✖ dplyr::lag()     masks stats::lag()
#> ✖ recipes::step()  masks stats::step()
#> • Learn how to get started at https://www.tidymodels.org/start/Shots on goal

Data spending

A first model

Basic features (inc dummy variables)

Different player encoding

Add shot angle?

Add shot from defensive zone?

Add shot behind goal line?

Nonlinear terms for angle and distance

Try another model

Switch to boosting and basic features

Boosting with location features

Choose wisely…

Finalize and verify
